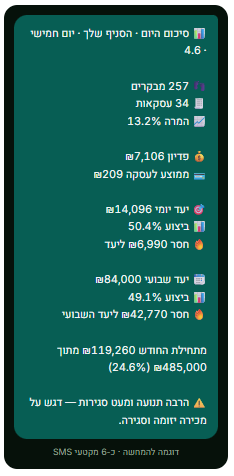
The daily summary, straight to your phone
At the end of every day a single SMS arrives — revenue, visitors, conversion rate and average transaction, each shown as actual against plan. At the bottom, a daily insight with a clear next step.
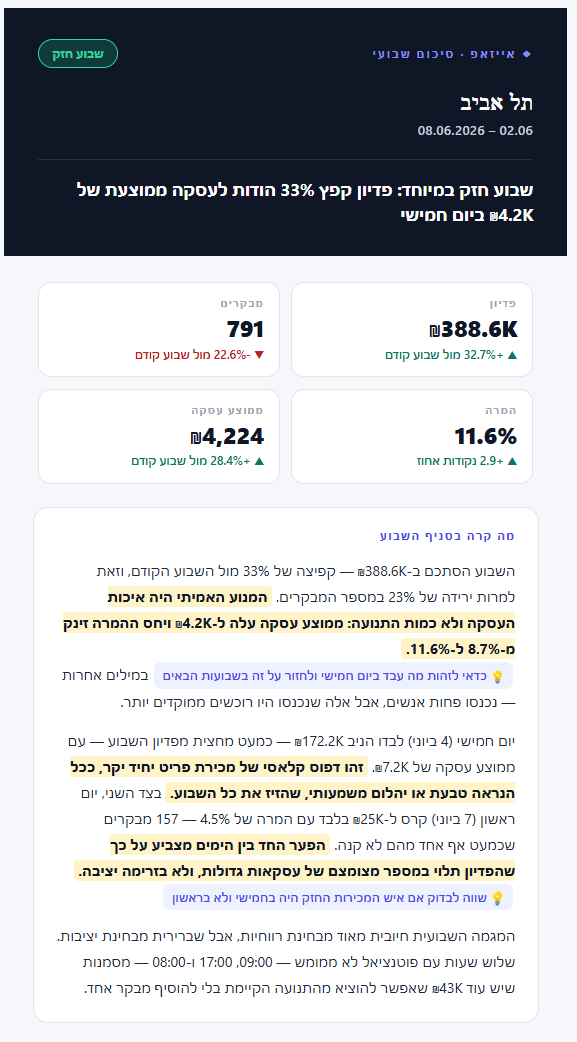
Email summaries
A summary in plain, everyday language that explains what is really going on — what happened at the branch this week, what moved revenue and why, all written the way a manager would tell you, straight to your inbox.
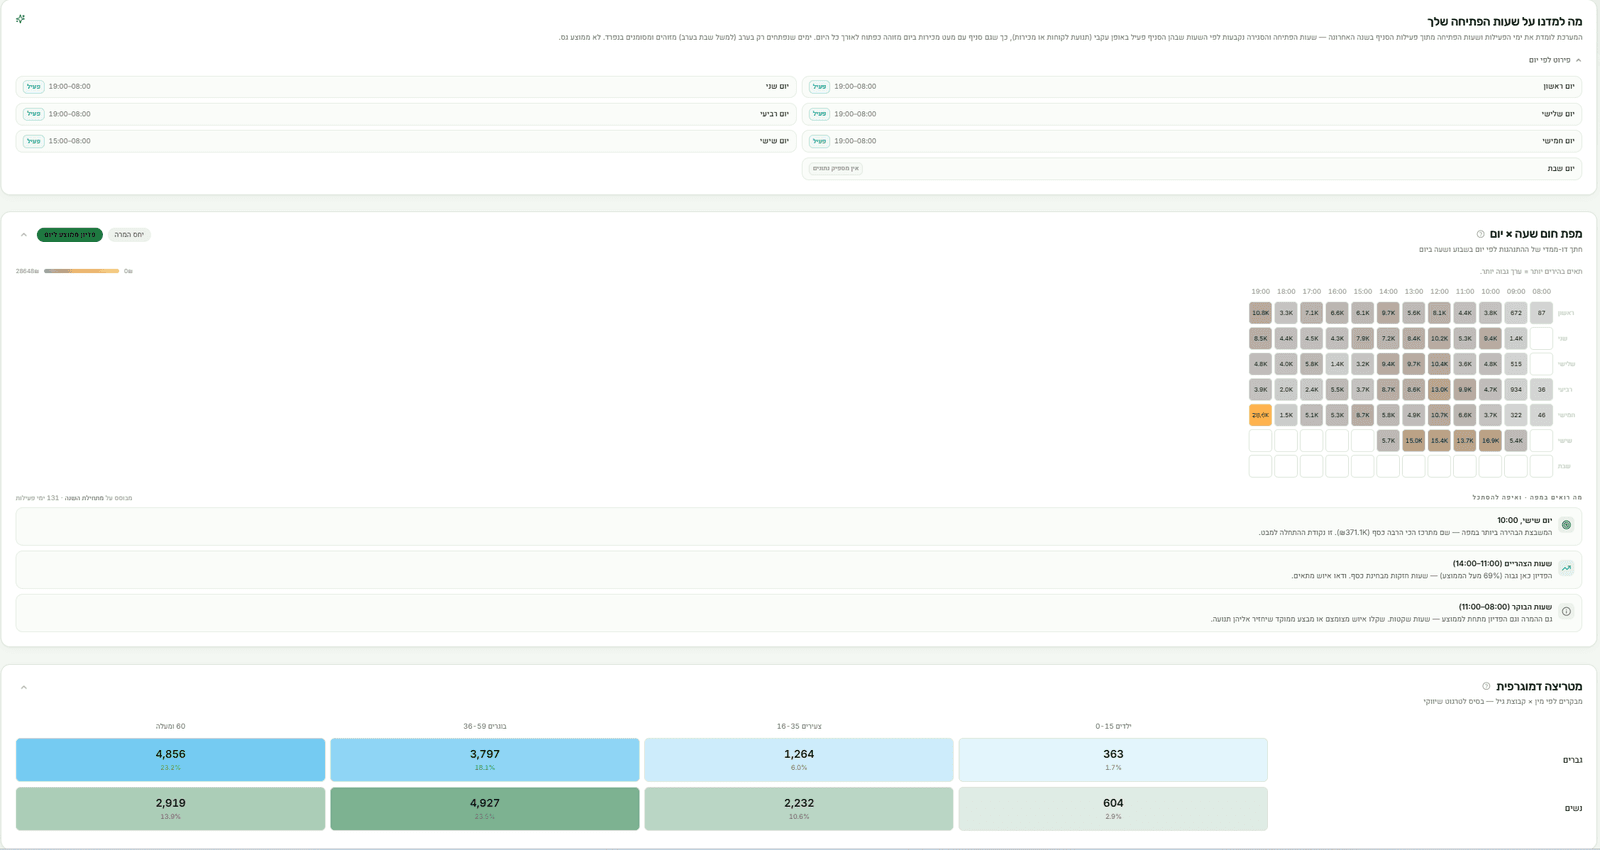
Your strongest hours, and the audience behind them
A heat map of revenue by hour and day of the week, alongside a demographic matrix of who actually walks into the branch — gender and age. So you know when to push, and who to aim at.
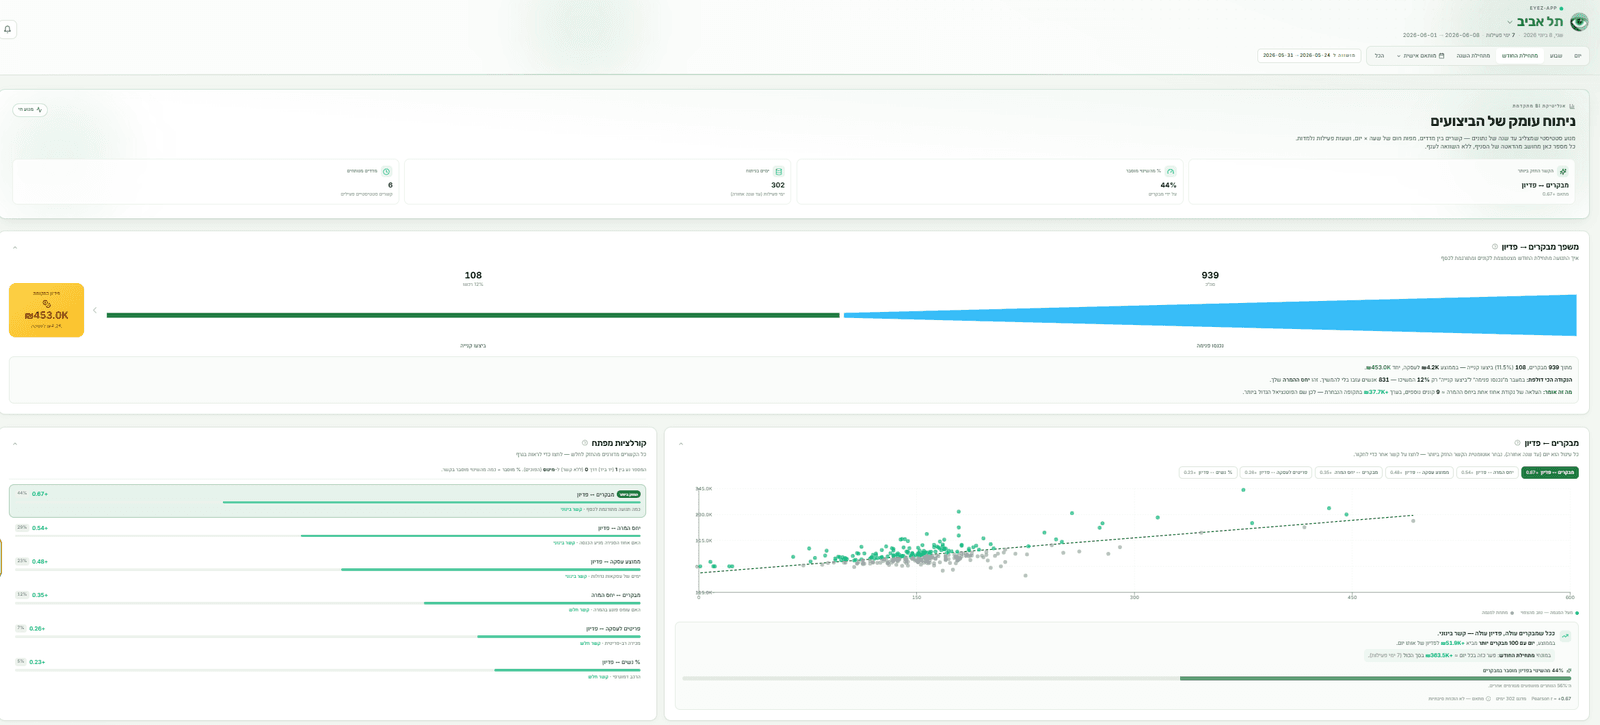
What actually moves revenue
A statistical engine that identifies which metrics have the biggest effect on sales growth — correlations, conversion funnel and trend analysis, computed from the branch's own history.
Set targets with a single click
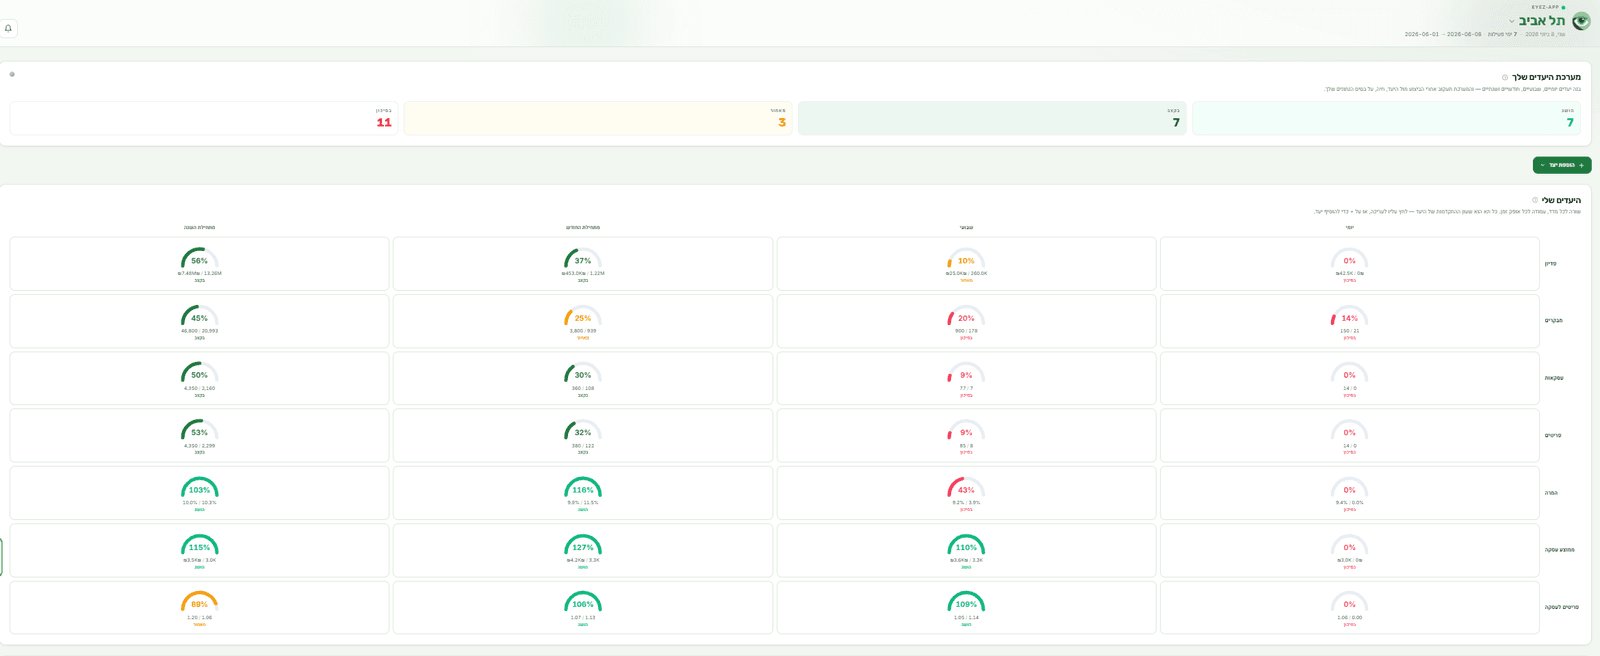
Pick a growth percentage and the platform builds daily, weekly, monthly and annual targets — with a separate progress meter for every metric and a clear read on whether company goals are being met.
Your pace, against last year
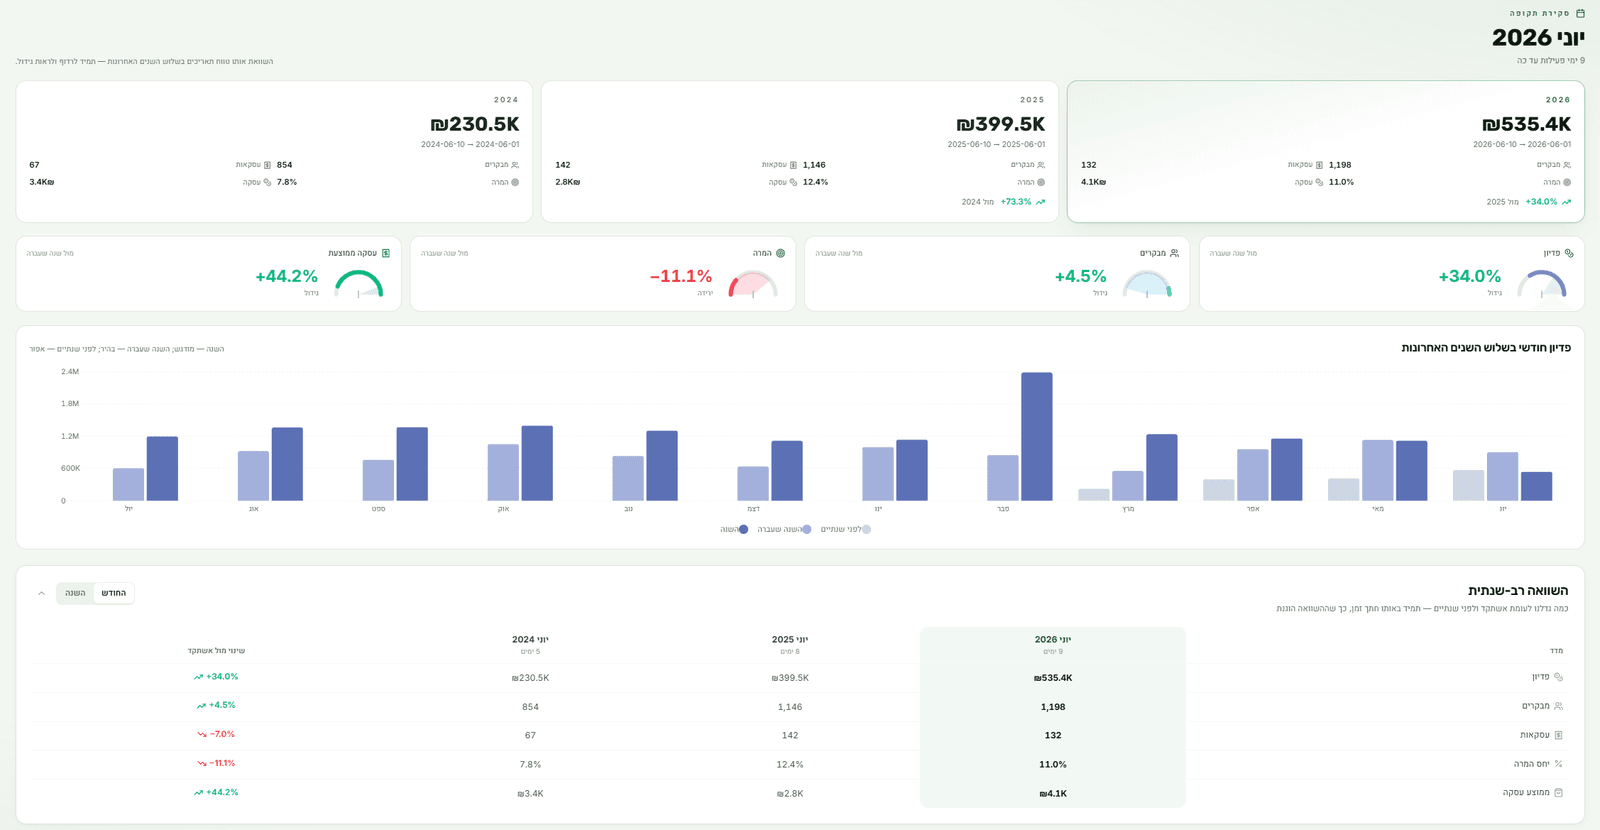
Compare revenue, visitors and transactions against the same date range in previous years and in the previous month — always like for like, so you know whether you really grew.
Every branch, on one screen
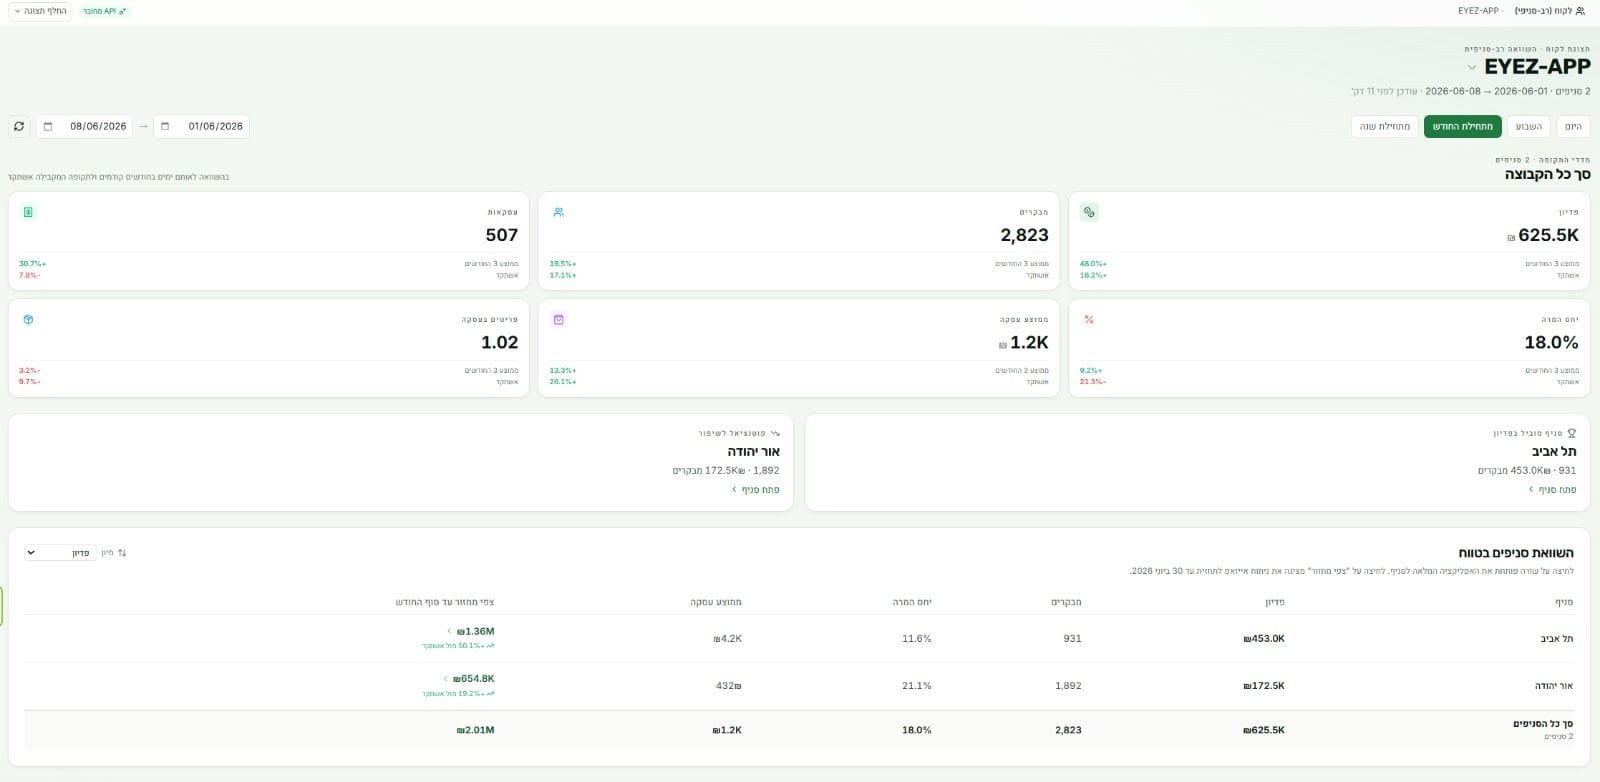
A multi-branch comparison of revenue, visitors, conversion rate and average transaction — with a turnover forecast for each branch based on its actual pace to the end of the month.
Frequently asked questions about the platform
What you see, how often, and who gets access — everything worth knowing about the EYEZ dashboard.
What data does the EYEZ dashboard show?
Visitor entries, conversion rates against the POS, demographic breakdown by age and gender, real-time occupancy, year-on-year comparisons between periods and branches, and weekly summaries sent by SMS and email.
Is the data shown in real time?
Yes. Occupancy, entries and conversion rates update in real time, and you can view them from anywhere — including your phone.
Can I compare branches and time periods?
Yes. The platform shows multi-year comparisons of revenue, visitors and conversion, plus performance comparisons across the branches in your chain — so you can spot trends and replicate what works.
Is there permission management for different users?
Yes. The platform supports multiple users with permissions tailored to every management level — from owner and CEO down to branch manager.
What alerts does the platform send?
Smart mobile alerts on changes in performance — a drop in a branch's conversion rate, for example — alongside daily and weekly reports in the dashboard, by SMS and by email.
How is the data kept free of duplicates?
The platform de-duplicates visitor and sales data at the point of collection, producing the clean, reliable dataset the insights are built on.